Feasibility of using a process control framework to simplify treatment planning decisions
Tina Orovwighose,
Germany
PO-1742
Abstract
Feasibility of using a process control framework to simplify treatment planning decisions
Authors: Tina Orovwighose1,2, Vania Batista1,2, Bernhard Rhein1,2,3, Oliver Jäkel1,2,3,4
1Heidelberg University Hospital, Department of Radiation Oncology, Heidelberg, Germany; 2Heidelberg Institute of Radiation Oncology , (HIRO), Heidelberg, Germany; 3Heidelberg Ion-Beam Therapy Center (HIT), Department of Radiation Oncology, Heidelberg, Germany; 4German Cancer Research Center (DKFZ), Dep. Medical Physics in Radiation Oncology, Heidelberg, Germany
Show Affiliations
Hide Affiliations
Purpose or Objective
This work explores the feasibility to use statistical
process control (SPC) on various plan evaluation metrics to standardize the
treatment planning decisions. Furthermore, these metrics were cross-correlated to
assess which parameters are more suitable to quantify plan quality.
Material and Methods
The baseline for the SPC was
established with a pilot data set of 105 VMAT bronchial treatment plans. The
centre line (CL), upper (UCL) , and lower control limit (LCL) were calculated for various parameters, such as dose coverage (DC), homogeneity index (HI), gradient index, PMU (plan
normalized monitor unit used to predict the degree of plan modulation (Park 2019, doi: 10.1002/acm2.12589)), plan
quality index (PQI, use to compare the achievement of planning goals) (Jornet 2014, doi.org/10.1016/j.radonc.2014.06.016),
dose differences and Gamma-index of an independent dose calculation-based (cD.Pat-QA)
and a measurement-based patient-specific plan verification (mPat.QA). The cross-calibration of 11 plan quality metrics was achieved
with the multivariable correlation (Pearson) and the parameters with the
strongest correlation were chosen to assess the plan quality.
Results
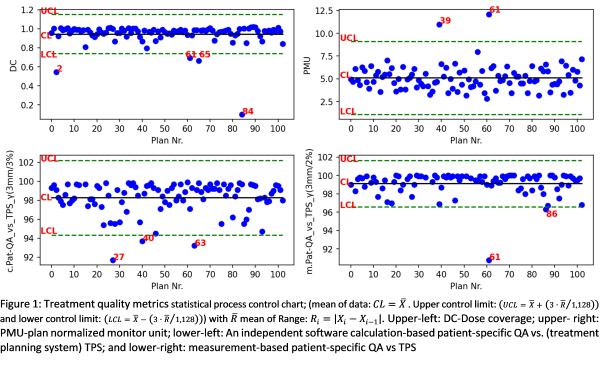
Fig.1 shows the result of the SPC
of four of the plan quality metrics that were examined. In general, a quick
overview of the plan quality and the weakness of a plan compared to the others
can be achieved. The analysis of the SPC showed some treatment plans have only
a single weakness (plan 2, poor DC), while others have multiple problems (plan
61, high PMU, poor DC, and gamma-index). The result of the multivariable
correlation analysis shows PMU, DC, and mPat-QA gamma index have multiple weak or
strong correlations with most of the plan quality metrics that were evaluated. Plan
quality index (PQI) didn´t correlate with any other plan quality metrics
evaluated. This is similar to the findings of Jornet 2014,
who found no correlation between plan complexity and PQI.

Conclusion
The plan quality metrics PMU, DC,
and mPat-QA gamma index are suitable to predict the treatment plan quality. Statistical
process control can be used to indicate poor plan quality. Integration of this
method in a TPS will allow comparing a newly calculated plan with the baseline shown
in this study. By introducing this method, plans with lower quality may be
identified earlier and more clearly during the workflow.