The MAE
during validation for support vector, linear regression, random forest,
XGBoost, and ANN were 0.210, 0.205, 0.188, 0.220, and 0.179 mm, respectively.
The RMSE during validation for support vector, linear regression, random
forest, XGBoost, and ANN were 0.122, 0.121, 0.285, 0.335, and 0.096 mm,
respectively. The MAE and RMSE achieved by each model during testing are
reported in the same order as the metrics reported for validation (support
vector, linear regression, random forest, XGBoost, and ANN). The maximum MAE
achieved during testing on leaves from Y1 bank were 0.335, 0.337, 0.300, 0.332,
and 0.296 mm, and the RMSE were 0.474, 0.478, 0.452, 0.479, and 0.441 mm. The
maximum MAE achieved during testing on leaves from Y2 bank were 0.518, 0.516,
0.532, 0542, and 0.508 mm, and the RMSE were 0.721, 0.726, 0.745, 0.667, and
0.709 mm. All models achieved a R2 value of 0.999 on the training,
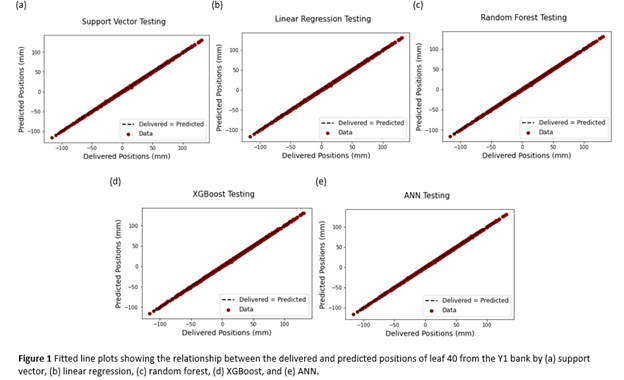
validation, and testing datasets. Table 1 summarizes the results for the training, validation, and testing datasets. Fitted-line plots for each model showing the relationship between the predicted and delivered positions for one leaf is shown in Figure 1. The results show that the models’ performance
on leaves from the Y2 bank were worse than their performance on leaves from the
Y1 bank.

