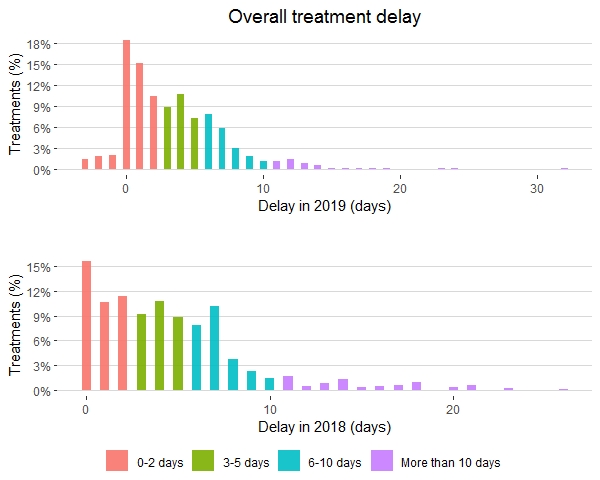
Mean overall treatment delay was 4.5 days (4 days median
value) during 2018 and 3.4 days during 2019 (3 days median value). This means a
reduction of 25.8%. In addition, a classification into intervals (0-2, 3-5,
6-10, and more than 10 days), according to the delay, was performed for a
deeper analysis. Figure 1 shows the percentage of patients regarding the delay
interval per year.

Figure 1. Delay intervals for each year.
In total, there
is a 12% reduction in the ‘0-2 day interval’, a 7% reduction in the ‘6-10 day
interval’, and a 3% reduction for ‘> 10 days’ interval. In addition, during
2019, 5% of the treatments were completed before the estimated finish date
(between 1 to 3 days earlier).
If we look at
treatment delay for pathology (Table 1), the OTT was reduced by 62% for rectum treatments,
38% for H&N, 35% for esophagus, 31% for gynecological, 31% for lung, and 18%
for breast. Treatments with higher priorities had a higher reduction in the OTT
in most cases.
|
Localization
|
2018 Delay (days)
|
2019 Delay (days)
|
OTT Reduction
|
|
H&N
|
8.0
|
5.0
|
38%
|
|
Gynecological
|
5.4
|
3.7
|
31%
|
|
SBRT
|
0
|
0.3
|
Same
|
|
Rectum
|
5.3
|
2.0
|
62%
|
|
Lung
|
4.9
|
3.4
|
31%
|
|
Esophagus
|
5.5
|
3.6
|
35%
|
|
CNS
|
5.0
|
4.3
|
14%
|
|
Prostate
|
5.0
|
5.4
|
Same
|
|
Breast
|
4.5
|
3.7
|
18%
|
|
Other
|
4.8
|
2.6
|
46%
|
|
Palliative
|
1.4
|
1.1
|
21%
|
Table 1. Delay mean
value for each localization and year
Finally, regarding the type of unscheduled interruptions,
25% of the patients suffered at least one interruption for machine breakdown
during 2018. This value was 30% for the patients treated in 2019.