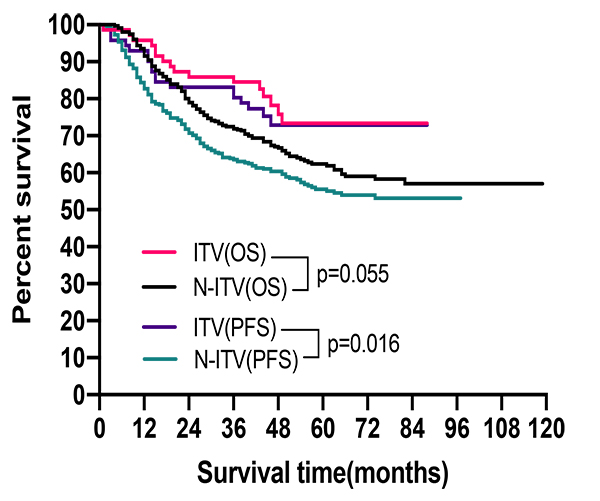
The median follow-up times were 49 months (1-119) and 45 months (1-97) for overall survival (OS) and progression-free survival (PFS), respectively. The 2-year, 3-year, and 5-year OS and PFS rates were 80.1%, 74.0%, 64.1% and 72.9%, 66.4%, 58.3%, respectively.
Compared to the N-ITV group, the ITV group had a better OS (HR (95% CI): 0.52 (0.27, 0.98), p=0.044) and PFS (HR (95% CI): 0.59 (0.36, 0.99), p=0.045) after multivariate analysis. The ITV delineation method was an independent prognostic factor for OS and PFS (Fig. 1).
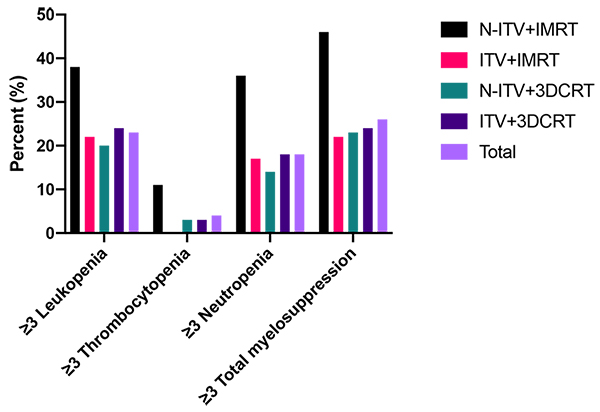
Of the four groups, the ITV+IMRT group had the lowest incidence of acute Hematological toxicity (HT) (p=0.000). The N-ITV+IMRT group had the highest incidence rates of grade 3 and grade 4 HT, at 31.6% and 14.5%, respectively. Only one patient had grade 4 Cystitis who was from the ITV+IMRT group. ITV+IMRT group was associated with numerically higher rates of acute severe vomiting and diarrhea when compared with the other groups. However, all the differences were not statistically significant(p=0.268, 0.063 respectively).
As shown in Fig. 2, Compared with the ITV+3DCRT group, the N-ITV+IMRT group had a significantly higher rate of acute radiation toxicity, and the ITV+IMRT and N-ITV+3DCRT groups had significantly lower rates of grade ≥3 leukopenia (38.2%, 22.0%, 19.9% vs. 24.2%, p=0.009), grade ≥3 thrombocytopenia (10.5%, 0%, 2.8% vs. 3%, p=0.007), and grade ≥3 neutropenia (35.5%, 17.1%, 13.8% vs. 18.2%, p=0.000). Regarding the impact of chemotherapy regimens on HT, the rates of grade ≥3 myelosuppression were lower in the DDP+PTXLs, nedaplatin and DDP+tegafur groups. They were in the DDP+5-FU and other groups than the DDP chemotherapy group (respectively, 16.1%, 25.9%, 27.6%, 41.7%, and 58.3% vs. 27.8%, p=0.000).
The results of the binary logistic regression model showed that different radiation plan types (ITV+IMRT and N-ITV+3DCRT vs N-ITV+IMRT: HR (95% CI): 0.35 (0.12,1.01) and 0.45 (0.24,0.82), respectively, p=0.052, 0.009) was one of independent risk factors for acute HT.

Fig. 1. Survival comparison between ITV and N-ITV groups.

Fig. 2. Acute HT comparison of groups.