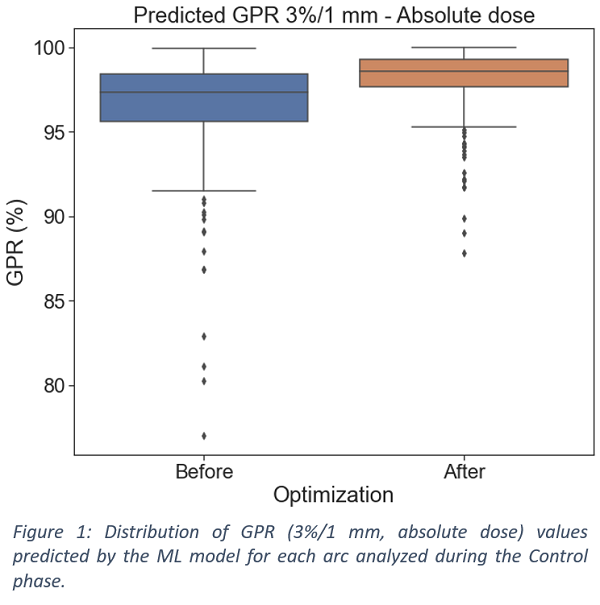
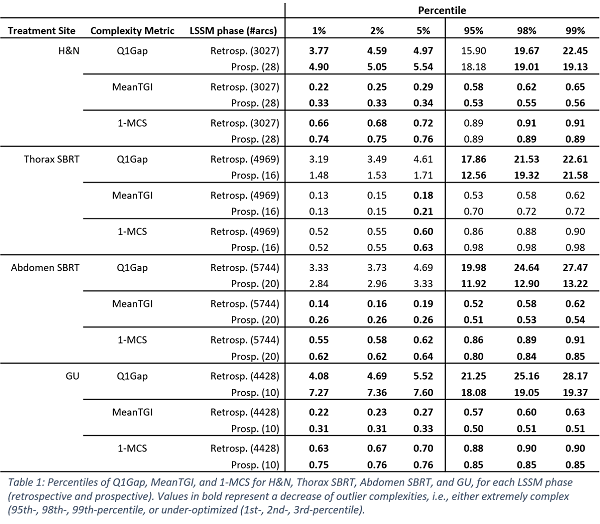
28424 retrospective VMAT plans (70197 arc) and 211 prospective VMAT plans (525 arcs) were analysed. With the DSS, 48 arcs (9.1%) were found to have more than 5 complexity metrics out of range and 50 arcs (9.5%) were flagged as potential PSQA failures by the ML model, i.e., GPR <92.5% (Figure 1). Corrective actions were taken by either re-optimizing the RT plan or changing the treatment machine. Overall, extreme cases reduced over the Control period. Table 1 reports the percentiles of the distributions of Q1Gap, MeanTGI and 1-MCS metrics, which characterize each VMAT arc in terms of beam aperture, tongue-and-groove effect, and MLC modulation, respectively. The values are shown for representative treatment sites, i.e., H&N, Thorax SBRT, Abdomen SBRT, and Gastro-urinary (GU). For the H&N, Abdomen SBRT, and GU, the 5th-percentile of the MeanTGI increased from 0.29, 0.19, 0.27 to 0.34, 0.26, 0.33, while the 95th-percentile reduced from 0.58, 0.52, 0.57 to 0.53, 0.51, 0.50, respectively.

