effects of nuclear interaction correction and trichrome fragment spectra modelling in CIRT planning
PO-1975
Abstract
effects of nuclear interaction correction and trichrome fragment spectra modelling in CIRT planning
Authors: Alessia Bazani1, Jacob Brunner2, Stefania Russo1, Antonio Carlino3, Daniel Simon Colomar4, Mario Ciocca1, Markus Stock3, Piero Fossati5, Ester Orlandi6, Lars Glimelius4, Silvia Molinelli1, Barbara Knäusl2,3
1CNAO National Center for Oncological Hadrontherapy, Medical Physics Unit, Pavia, Italy; 2Medical University of Vienna, Department of Radiation Oncology, Vienna, Austria; 3MedAustron Ion Therapy Center, Medical Physics Unit, Wiener Neustadt, Austria; 4Raysearch Laboratories, Physics, Stockholm, Sweden; 5MedAustron Ion Therapy Center, Radiation Oncology Unit, Wiener Neustadt, Austria; 6CNAO National Center for Oncological Hadrontherapy, Radiation Oncology Unit, Pavia, Italy
Show Affiliations
Hide Affiliations
Purpose or Objective
To assess the effects of nuclear interaction correction (NIC) and trichrome (TRI) fragment spectra modelling on the RBE-weighted dose (DRBE) and dose-averaged LET (LETd) distributions for clinical carbon ion dose calculation.
Material and Methods
Thirty clinically applied carbon ion radiotherapy (CIRT) plans, previously optimized with local effect model (LEM) I (nominal plans) in the clinical available version of Raystation TPS were recalculated including NIC, applying TRI spectra modelling and the combination of both NIC+TRI (evaluation plans) in version 11B-DTK (PBv4.4), respectively. Plans were grouped according to treatment sites: prostate adenocarcinoma (PCa, 6), head and neck (H&N, 10), pancreatic adenocarcinoma (LAPC, 9), sacral chordoma (SC, 5). Dosimetric parameters were compared for the CTV and ring-dose regions retrieved from the nominal plan, namely the volume between CTV and 90% isodose (iso90%), 90% and 40% isodose (iso40%), 40% and 10% isodose (iso10%).
• CTV coverage (D98%, D50% and D2%)
• median dose to ring-dose regions
• global gamma analyses restricted to dose regions with 1% dose difference (DD) – 1 mm distance to agreement (DTA), with no dose threshold.
• median LETd values for CTV and ring-dose regions, with the addition of the volume included between 10% and 0.5% isodoses (iso0.5%).
Median percentage dose and LETd deviations and interquartile (IQ) ranges with respect to the nominal plans (ΔD% and ΔLETd) and mean gamma passing rates (γ) were reported for NIC+TRI plans, grouped for the different treatment sites.
Results
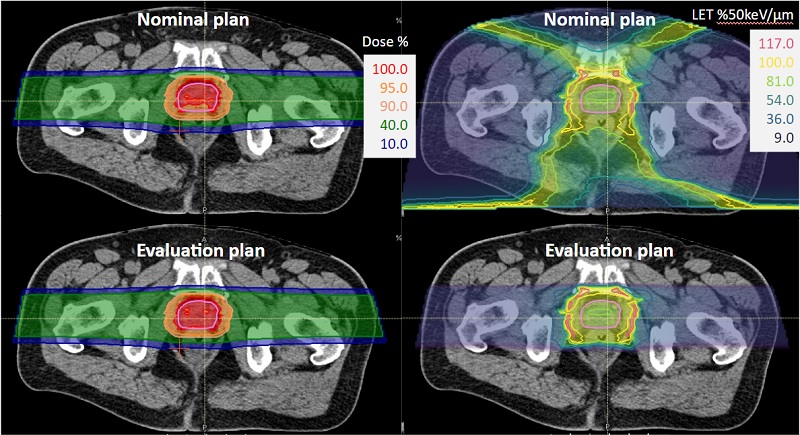
For CTV, iso90% and iso40%, median ΔD% were within ±1% and mean γ-values were ≥95% (Table 1), while changes up to -1.5% were observed for iso10%, exemplarily shown in figure 1 together with the LETd distribution.

CTV
| PCa
| H&N
| LAPC
| SC
|
ΔD98% (IQ)
| 0.18 (0.02)
| 0.00 (0.18)
| -0.10 (0.23)
| -0.39 (0.24)
|
ΔD50% (IQ)
| 0.22 (0.61)
| 0.05 (0.11)
| -0.07 (0.21)
| -0.33 (0.21)
|
ΔD2% (IQ)
| 0.23 (0.24)
| 0.03 (0.19)
| -0.05 (0.20)
| -0.24 (0.21)
|
iso90%
|
|
|
|
|
ΔD50% (IQ)
| 0.18 (0.21)
| 0.05 (0.11)
| 0.00 (0.17)
| -0.27 (0.13)
|
γ (1%-1 mm) (%)
| 99.96
| 99.87
| 100.00
| 100.00
|
iso40%
|
|
|
|
|
ΔD50% (IQ)
| 0.03 (0.11)
| -0.13 (0.11)
| -0.18 (0.10)
| -0.31 (0.15)
|
γ (1%-1 mm) (%)
| 99.84
| 99.93
| 99.98
| 99.99
|
iso10%
|
|
|
|
|
ΔD50% (IQ)
| -0.72 (0.64)
| -0.75 (0.73)
| -0.42 (0.93)
| -0.28 (0.87)
|
γ (1%-1 mm) (%)
| 97.10
| 99.95
| 99.54
| 99.87
|
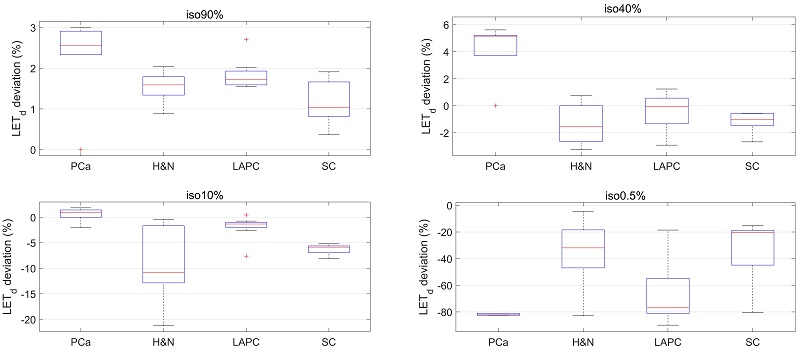
No significant LETd deviations were reported in the CTV; median ΔLETd and interquartile ranges for ring-dose regions show absolute differences up to 80% for very low dose regions, as depicted in figure 2.

Conclusion
The introduction of NIC+TRI resulted in clinically acceptable dose deviations for all investigated treatment sites. The updated modelling of nuclear interactions and fragment spectra provided more realistic results on energy deposition and LETd maps, particularly in the medium and low dose regions. Further investigation is needed to assess the deviations with respect to the FLUKA MC code.