Impact of the VOLO Optimizer on Treatment Plan Quality of Stereotactic Prostate Radiotherapy.
PO-2052
Abstract
Impact of the VOLO Optimizer on Treatment Plan Quality of Stereotactic Prostate Radiotherapy.
Authors: Tuomas Viren1, Jan Seppälä1
1Kuopio University Hospital, Center of Oncology, Kuopio, Finland
Show Affiliations
Hide Affiliations
Purpose or Objective
VOLO-optimizer was developed to improve the performance and efficiency of previous Sequential optimizer (SO) on Cyberknife treatment planning. The aim of this study was to investigate the impact of the VOLO optimizer on the quality of stereotactic treatment plans of prostate cancer.
Material and Methods
A total of 674 patients who received a stereotactic radiotherapy for prostate cancer between 2017 and 2022 were selected for the analysis. Treatment plans created before and after January 2021 were optimized using SO (n = 366, MultiPlan, Accuray, USA) and VOLO (n = 308, Precision, Accuray, USA), respectively. All the patients were treated in five fractions to total dose of 35 Gy or 36.25 Gy using Iris collimator. Before the analysis, the 35 Gy treatment plans were re-normalized to prescription dose of 36.25 Gy. Volume(cc), D95%(Gy) and D0.5cc(Gy) for PTV, mean dose, D0.5cc and D2cc for rectum and bladder, and Body mean dose were extracted from the data. Conformality index (CI) and dose gradient index (DGI) were calculated from the dose distributions. DGI was determined as a ratio of the volume of 50% the prescription dose to the volume of the prescription dose. CI was defined as the ratio of the prescription isodose volume to the PTV volume. An average DVH for PTV, bladder and rectum and distance-to-target dose histogram (DDH) for bladder rectum and normal tissue (excluding bladder and rectum) were calculated. To calculate DDH, distance-to-target was determined for each target volume voxel (i.e. normal tissue, rectum and bladder). Subsequently, dose values of each target volume voxel were signed to bin according to distance-to-target (width 1 mm). Finally, DDH was determined by calculating mean value for each bin. Statistical significance between the groups were determined using unpaired t-test. Level of statistical significance was set to p<0.05.
Results
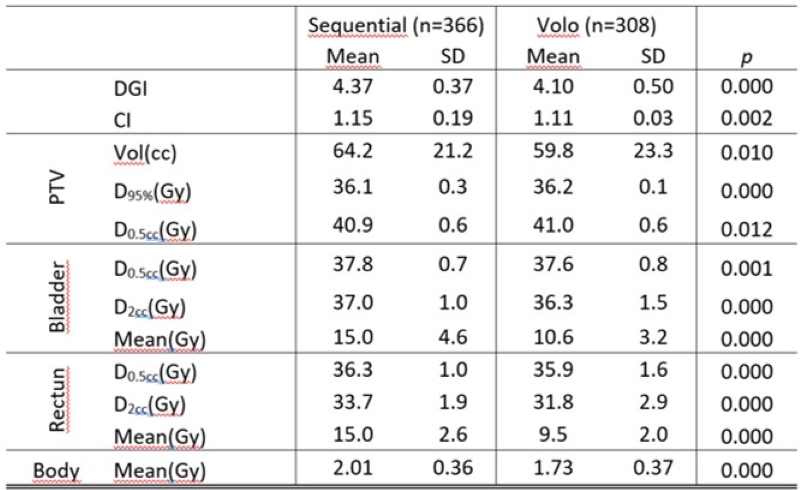
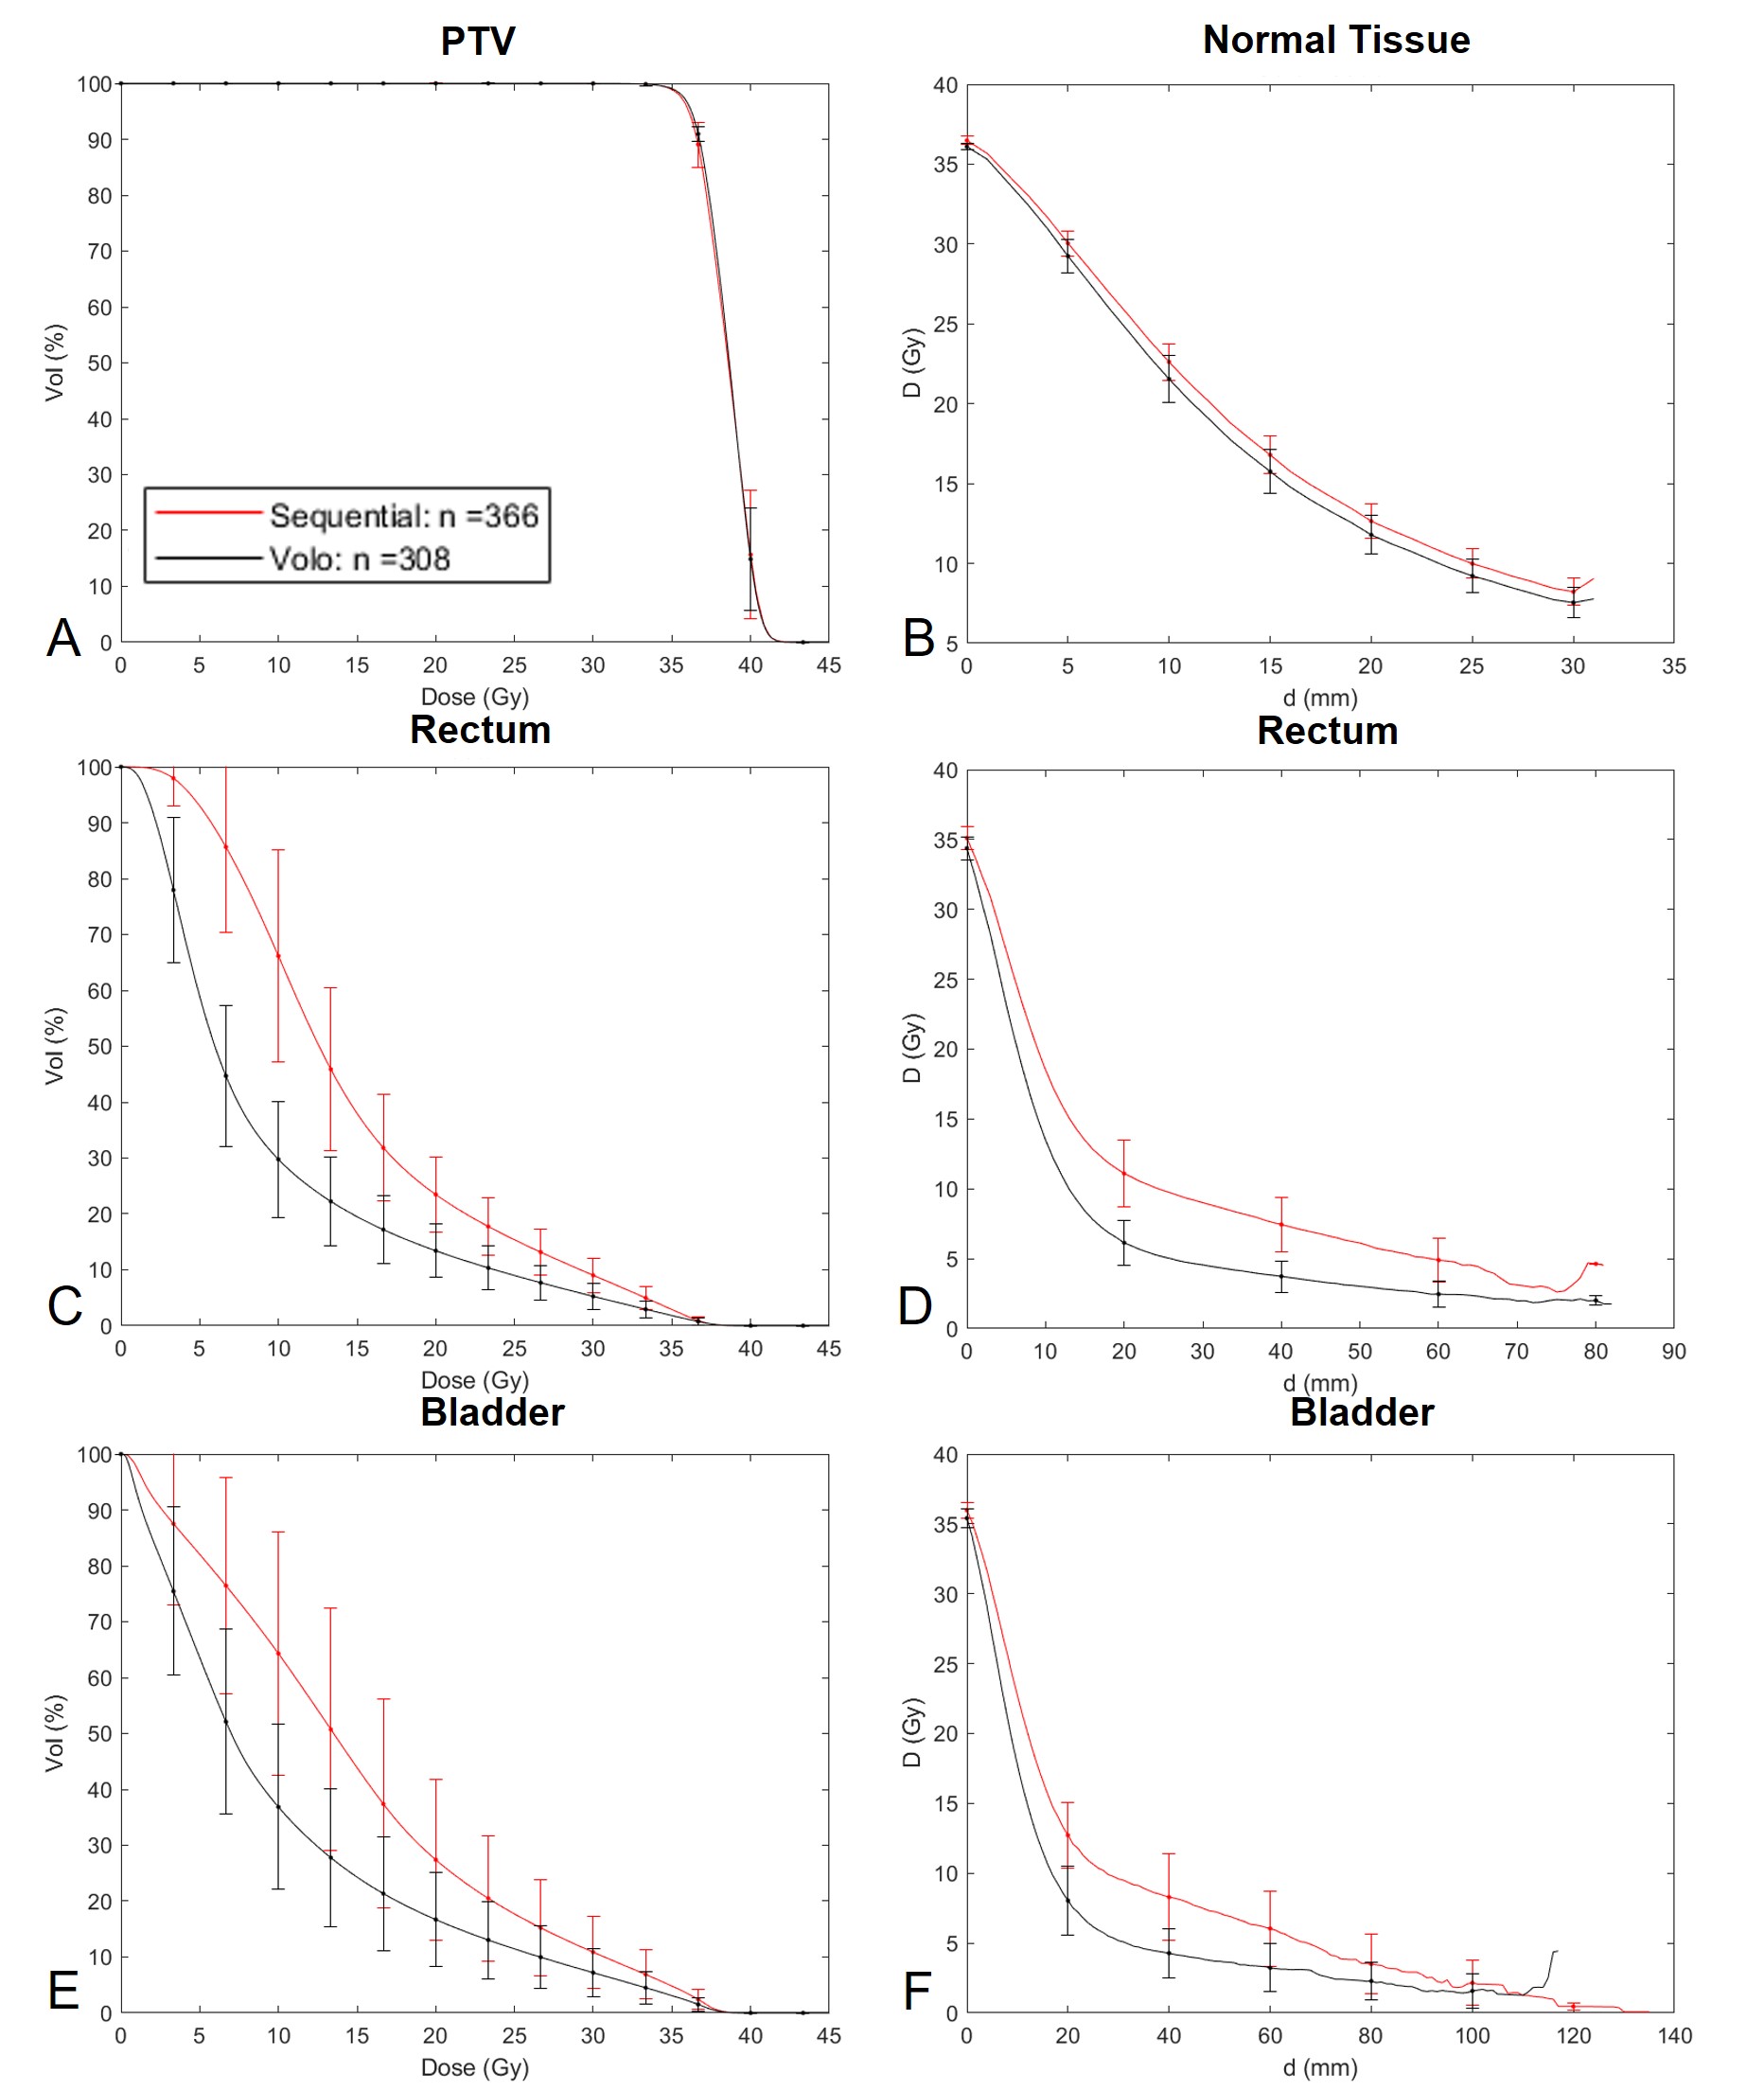
Volume of PTV was found to be 6.9% larger in SO group as compared to those in VOLO group (Table 1). Average DVHs for PTV, bladder and rectum and DDHs for normal tissue, bladder and rectum are presented in Figure 1. Only minor differences were detected in D95% or D0.5cc between the SO and VOLO groups. Mean dose to rectum and bladder were reduced by 36.5% and 29.8% when comparing VOLO to SO plans (Table 1). Smaller differences (0.5-5.8%) where detected in D0.5cc and D2cc values between SO and VOLO groups. GI and CI were reduced by 6% and 3% respectively with VOLO optimizer.
Table 1. Mean and standard deviation (SD) calculated for DVH parameters.


Figure 1. Average DVH for PTV (A), rectum (C) and bladder (E); and average DDH for normal tissue (B), rectum (D) and bladder (F).
Conclusion
VOLO optimizer significantly improved the treatment plan quality as compared to SO. Significant reduction in bladder and rectum doses were seen after the upgrade from SO to VOLO. As compared to SO steeper dose gradients towards bladder and rectum were created with VOLO without compromising the dose gradient in other directions nor increasing the mean body dose.