Manual or automatic heart contours do not lead to difference in predicted survival in NSCLC patients
Miguel Fernandes,
The Netherlands
PO-2116
Abstract
Manual or automatic heart contours do not lead to difference in predicted survival in NSCLC patients
Authors: Miguel Fernandes1, Johan Bussink1, Robin Wijsman2, René Monshouwer1, Barbara Stam3
1Radboudumc, Radboud Institute for Health Sciences, Radiation Oncology, Nijmegen, The Netherlands; 2University Medical Center Groningen, Radiation Oncology, Groningen, The Netherlands; 3Netherlands Cancer Institute-Antoni van Leeuwenhoek, Radiation Oncology, Amsterdam, The Netherlands
Show Affiliations
Hide Affiliations
Purpose or Objective
ROI contouring indirectly affects predicted Normal Tissue Complication Probabilities (NTCPs) via the dosimetric parameters computed from them, which are used as features in NTCP models. In this study, we use three sets of heart contours on the same dataset of NSCLC patients and investigate whether the differences between those contours cause differences in NTCP models.
Material and Methods
Manual, atlas, and deep learning (DL) based whole heart contours were available for a dataset of 646 locally advanced NSCLC patients acquired at a single institute. Mean Dice between contour sets was as follows: manual vs DL – 88.6 % ± 4.4 %, manual vs atlas – 82.1 % ± 4.6 %, DL vs atlas – 81.7 % ± 2.9 %. Dosimetric parameters mean heart dose (MHD) and volume of heart receiving at least 2 Gy (heart V2) were extracted from the 3 sets of contours. Independent Lyman-Kutcher-Burman (LKB) NTCP models were fit using the three contour sets to overall survival at 12 months as endpoint. Model parameter uncertainties were computed from the associated profile likelihoods.
Results
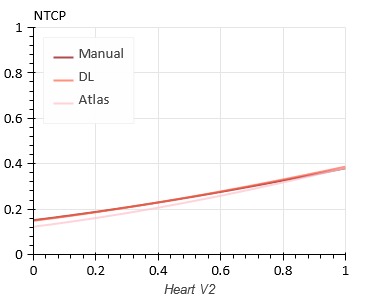
Model parameter coefficients are shown in Table 1. MHD and heart V2 parameters derived from the three sets of contours were comparable and show overlapping confidence intervals. Similar values for negative log likelihood (NLL) and AUC were found for the two groups of dosimetric parameters indicating that the three contours lead to equally good fits of the data. The three NTCP curves fitted to heart V2 are shown in Figure 1.
| Parameter | D_50 | m | NLL | AUC |
| MHD(Manual) | 39.31 (26.86-110.28) | 1.27 (0.43-1.63)
| 354.27 | 0.59 |
| MHD(DL) | 36.63 (26.26-81.06)
| 1.21 (0.50-1.55)
| 353.12 | 0.60 |
| MHD(Atlas) | 44.53 (31.84-117.53)
| 1.14 (0.41-1.54)
| 354.33 | 0.58 |
V2(Manual)
| 1.42 (1.14-2.38)
| 0.97 (0.20-1.29)
| 350.86 | 0.60 |
V2(DL)
| 1.38 (1.10-2.26)
| 0.96 (0.27-1.27)
| 350.59 | 0.60 |
V2(Atlas)
| 1.35 (1.10-2.16)
| 0.86 (0.22-1.18)
| 350.89 | 0.59 |
Table 1. Parameters values (D_50, m) for LKB models fitted to MHD and heart V2 parameters using sets of heart contours from three different sources: manual, deep learning, and atlas, and the associated negative log likelihoods and AUCs.

Figure 1. LKB-predicted NTCP as a function of Heart V2 computed from manual, DL, and atlas contours.
Conclusion
In this dataset of 646 NSCLC patients with OS as endpoint, there was no difference between NTCP models based on manual, atlas or DL segmented heart contours. In a dataset with a steeper dose-effect relation the contouring method could possibly play a role in the NTCP models.